-
Web Resources
-
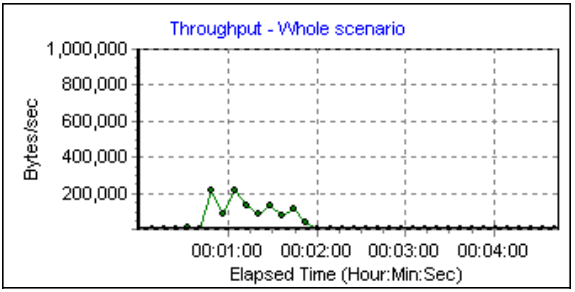
Throughput: The Throughput metric shows the amount of throughput on the Web server (y-axis)
during each second of the scenario run (x-axis). Throughput is measured in bytes and represents the
amount of data that the Vusers received from the server at any given second.
-
Hits per Second: The Hits per Second metric shows the number of hits (HTTP requests) to the Web
server (y-axis) as a function of the elapsed time in the scenario (x-axis). This graph can display the
whole step, or the last 60, 180, 600, or 3600 seconds.
-
HTTP Responses per Second: The HTTP Responses per Second metric shows the number of HTTP status
codes (y-axis)—which indicate the status of HTTP requests, for example, “the request was successful” or
“the page was not found”—returned from the Web server during each second of the scenario run (x-axis),
grouped by status code.
-
Pages Downloaded per Second: The Pages Downloaded per Second metric shows the number of Web
pages (y-axis) downloaded from the server during each second of the scenario run (x-axis). This graph
helps you evaluate the amount of load Vusers generate, in terms of the number of pages downloaded.
-
Retries per Second: The Retries Per Second metric shows the number of attempted Web server
connections (y-axis) as a function of the elapsed time in the scenario (xaxis). A server connection is
retried when the initial connection was unauthorized, when proxy authentication is required, when the
initial connection was closed by the server, when the initial connection to the server could not be
made, or when the server was initially unable to resolve the load generator’s IP address.
-
Connections: The Connections metric shows the number of open TCP/IP connections (y-axis) at each
point in time of the scenario (x-axis). One HTML page may cause the browser to open several
connections, when links on the page go to different Web addresses. Two connections are opened for each
Web server
-
Connections per Second: The Connections Per Second metric shows the number of new TCP/IP
connections (y-axis) opened and the number of connections that are shut down each second of the
scenario (x-axis). This number should be a small fraction of the number of hits per second, because new
TCP/IP connections are very expensive in terms of server, router and network resource consumption.
Ideally, many HTTP requests should use the same connection, instead of opening a new connection for
each request.
-
SSLs per Second: The SSLs per Second metric shows the number of new and reused SSL Connections
(y-axis) opened in each second of the scenario (x-axis). An SSL connection is opened by the browser
after a TCP/IP connection has been opened to a secure server. Because creating a new SSL connection
entails heavy resource consumption, you should try to open as few new SSL connections as possible; once
you’ve established an SSL connection, you should reuse it. There should be no more than one new SSL
connection per Vuser.
-
Transaction Monitoring
-
The Transaction monitor displays the transaction rate and response time during scenario
execution.
-
Transaction Response Time: The Transaction Response Time metric shows the average response time
of transactions in seconds (y-axis) as a function of the elapsed time in the scenario (x-axis).
-
Transactions per Second (Passed, Failed, Stopped): The Transactions per Second (Passed, Failed,
Stopped) metric shows the number of successful, failed and stopped transactions performed per second
(y-axis) as a function of the elapsed time in the scenario (x-axis).
-
Total Transactions per Second (Passed): The Total Transactions per Second (Passed) metric shows
the total number of completed, successful transactions per second (y-axis) as a function of the elapsed
time in the scenario (x-axis).
|
